A common mistake when trying to identify the relevant metrics to assess the performance of a product or a design is starting by asking “Which metrics should we use?” That is, starting with metrics.
When we approach measurement in a data-first way, what we usually end up with is a long list of metrics full of noise, which makes it harder to identify which metrics actually matter. In many cases, this leads to analysis paralysis.
Starting with metrics also leads to what I often call the metrics illusion: confusing having a lot of data with having the right data to make decisions.
An alternative and far more effective approach is to start with the question we want to answer, which is directly tied to the project goal. In other words, a Questions First approach.
Starting the measurement process by thinking about goals helps us find the relevant metrics even if we “don’t know anything about metrics” (*).
If you are a designer, read the clarification at the end of this article.
What is the “Questions First” approach?
The Questions First approach consists of starting the measurement process by thinking about the objective behind the design, product, or feature.
Starting this way allows us to:
- Identify which metrics are actually relevant
- Avoid analysis paralysis
- Make sense of the numbers
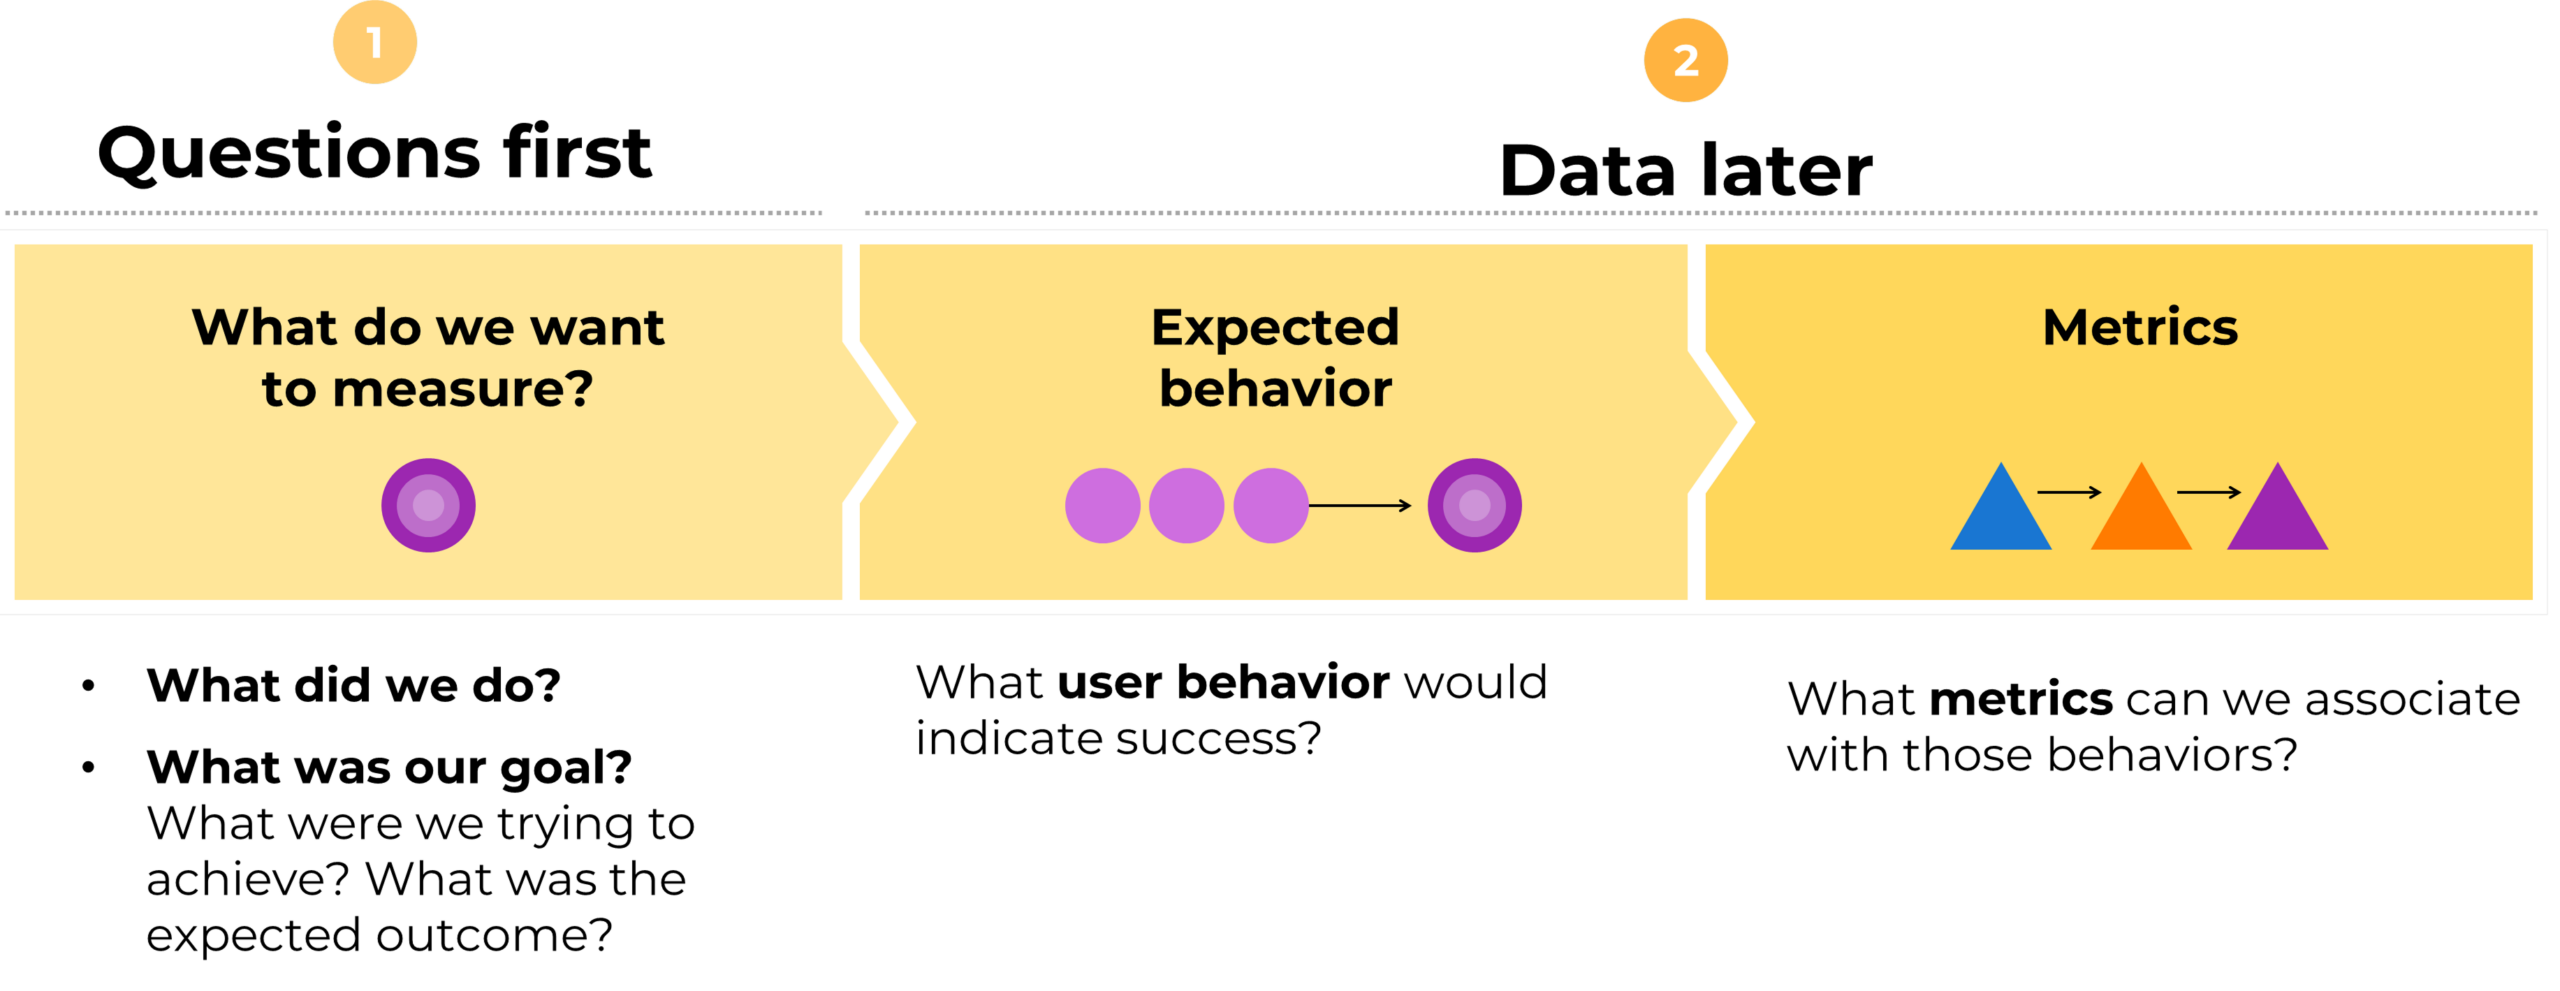
“Questions First”: a three-step process
Step 1: What do we want to measure?
As mentioned before, the first step is to identify what we want to measure. To do this, we go back to the project objective:
- What did we do?
- Why did we do it? What result did we expect to achieve?
Important: at this step, we are bringing existing objectives into the conversation, not defining new ones.
The why must be clear before starting the design process. If we don’t know why we did what we did, how can we know whether we actually created impact?
Step 2: Behavior
In this step, we identify the behaviors we should observe in users if the project achieved its objective.
Here, the concepts of core action and supporting actions are extremely helpful.
- Core action: the main action the user must take in order to obtain value from the product or feature
- Supporting actions: actions that enable or facilitate the core action
Important: supporting actions are not an inventory of everything a user can do in the product. They are only the actions that are necessary or enabling for the user to reach the core action in a given context.
This clarification is important because one of the most common mistakes when defining relevant metrics is listing all possible user actions (clicks, scrolls, page views, tagged events, etc.) instead of identifying only those actions that lead to the core action we want to measure—which, of course, is directly related to the project objective.
Step 3: Metrics
Steps 1 and 2 pave the way for identifying the relevant metrics that allow us to answer the question from Step 1 and evaluate whether we achieved our objective—and to what extent.
At this stage, we identify the metrics that can be associated with the behaviors identified in Step 2.
To measure real impact, it is essential to connect usage metrics with product and business metrics.
An example
Let’s assume we are Spotify and, until now, the platform has only offered music. A few months ago, we launched an MVP that adds Podcasts, and now we want to understand whether this MVP is performing well enough to become a permanent feature.
If we apply the Questions First approach…
Step 1: What question do we want to answer?
- We want to know whether users are interested in the new podcasts section (what we did).
- This feature is expected to support retention and acquisition (why we did it).
Step 2: Behavior
What behaviors would we need to observe to know that we achieved our objective?
We would expect users to:
- Reach the podcasts section
- Stay
- Use it
- Browse the catalog
- Open at least N titles
- Listen for at least N minutes across N podcasts
- Return to the podcasts section in subsequent sessions at least X times within a given period (for example, three times in one month)
- Cancel subscriptions less frequently
- Acquire new users at a faster rate than before
The last point is important: if acquisition grows at the same pace as before, we cannot confidently attribute that growth to the new feature.
Notice how:
- Steps 1 and 2 are supporting actions
- Steps 3 and 4 represent the core action
- Steps 5 and 6 are business outcomes resulting from delivering value to users (having music and podcasts on the same platform)
Step 3: Metrics
Once the relevant behaviors are identified, we can associate metrics to them based on the core action we want to measure.
Potential metrics include:
- Percentage of visits to the podcasts section—and its month-over-month evolution (or its opposite: bounce rate)
- Number of users who listen to a podcast—and its month-over-month evolution
- Number of podcasts / minutes listened per user, per visit
- Share of podcast minutes relative to total listening time on the platform—and its evolution (percentage of time spent listening to podcasts vs. music)
- Recurrence (number of visits per month) and frequency (how often users return)
- Retention
- Acquisition
Two important notes about these metrics
- They include only behaviors and actions that are relevant to the core action. This is why metrics such as total platform visits, time on site, error rate, or CTA clicks are excluded.
- The listed metrics include usage, product, and business metrics. They don’t measure a single dimension in isolation; they show how usage translates into product performance and how that, in turn, translates into business results.
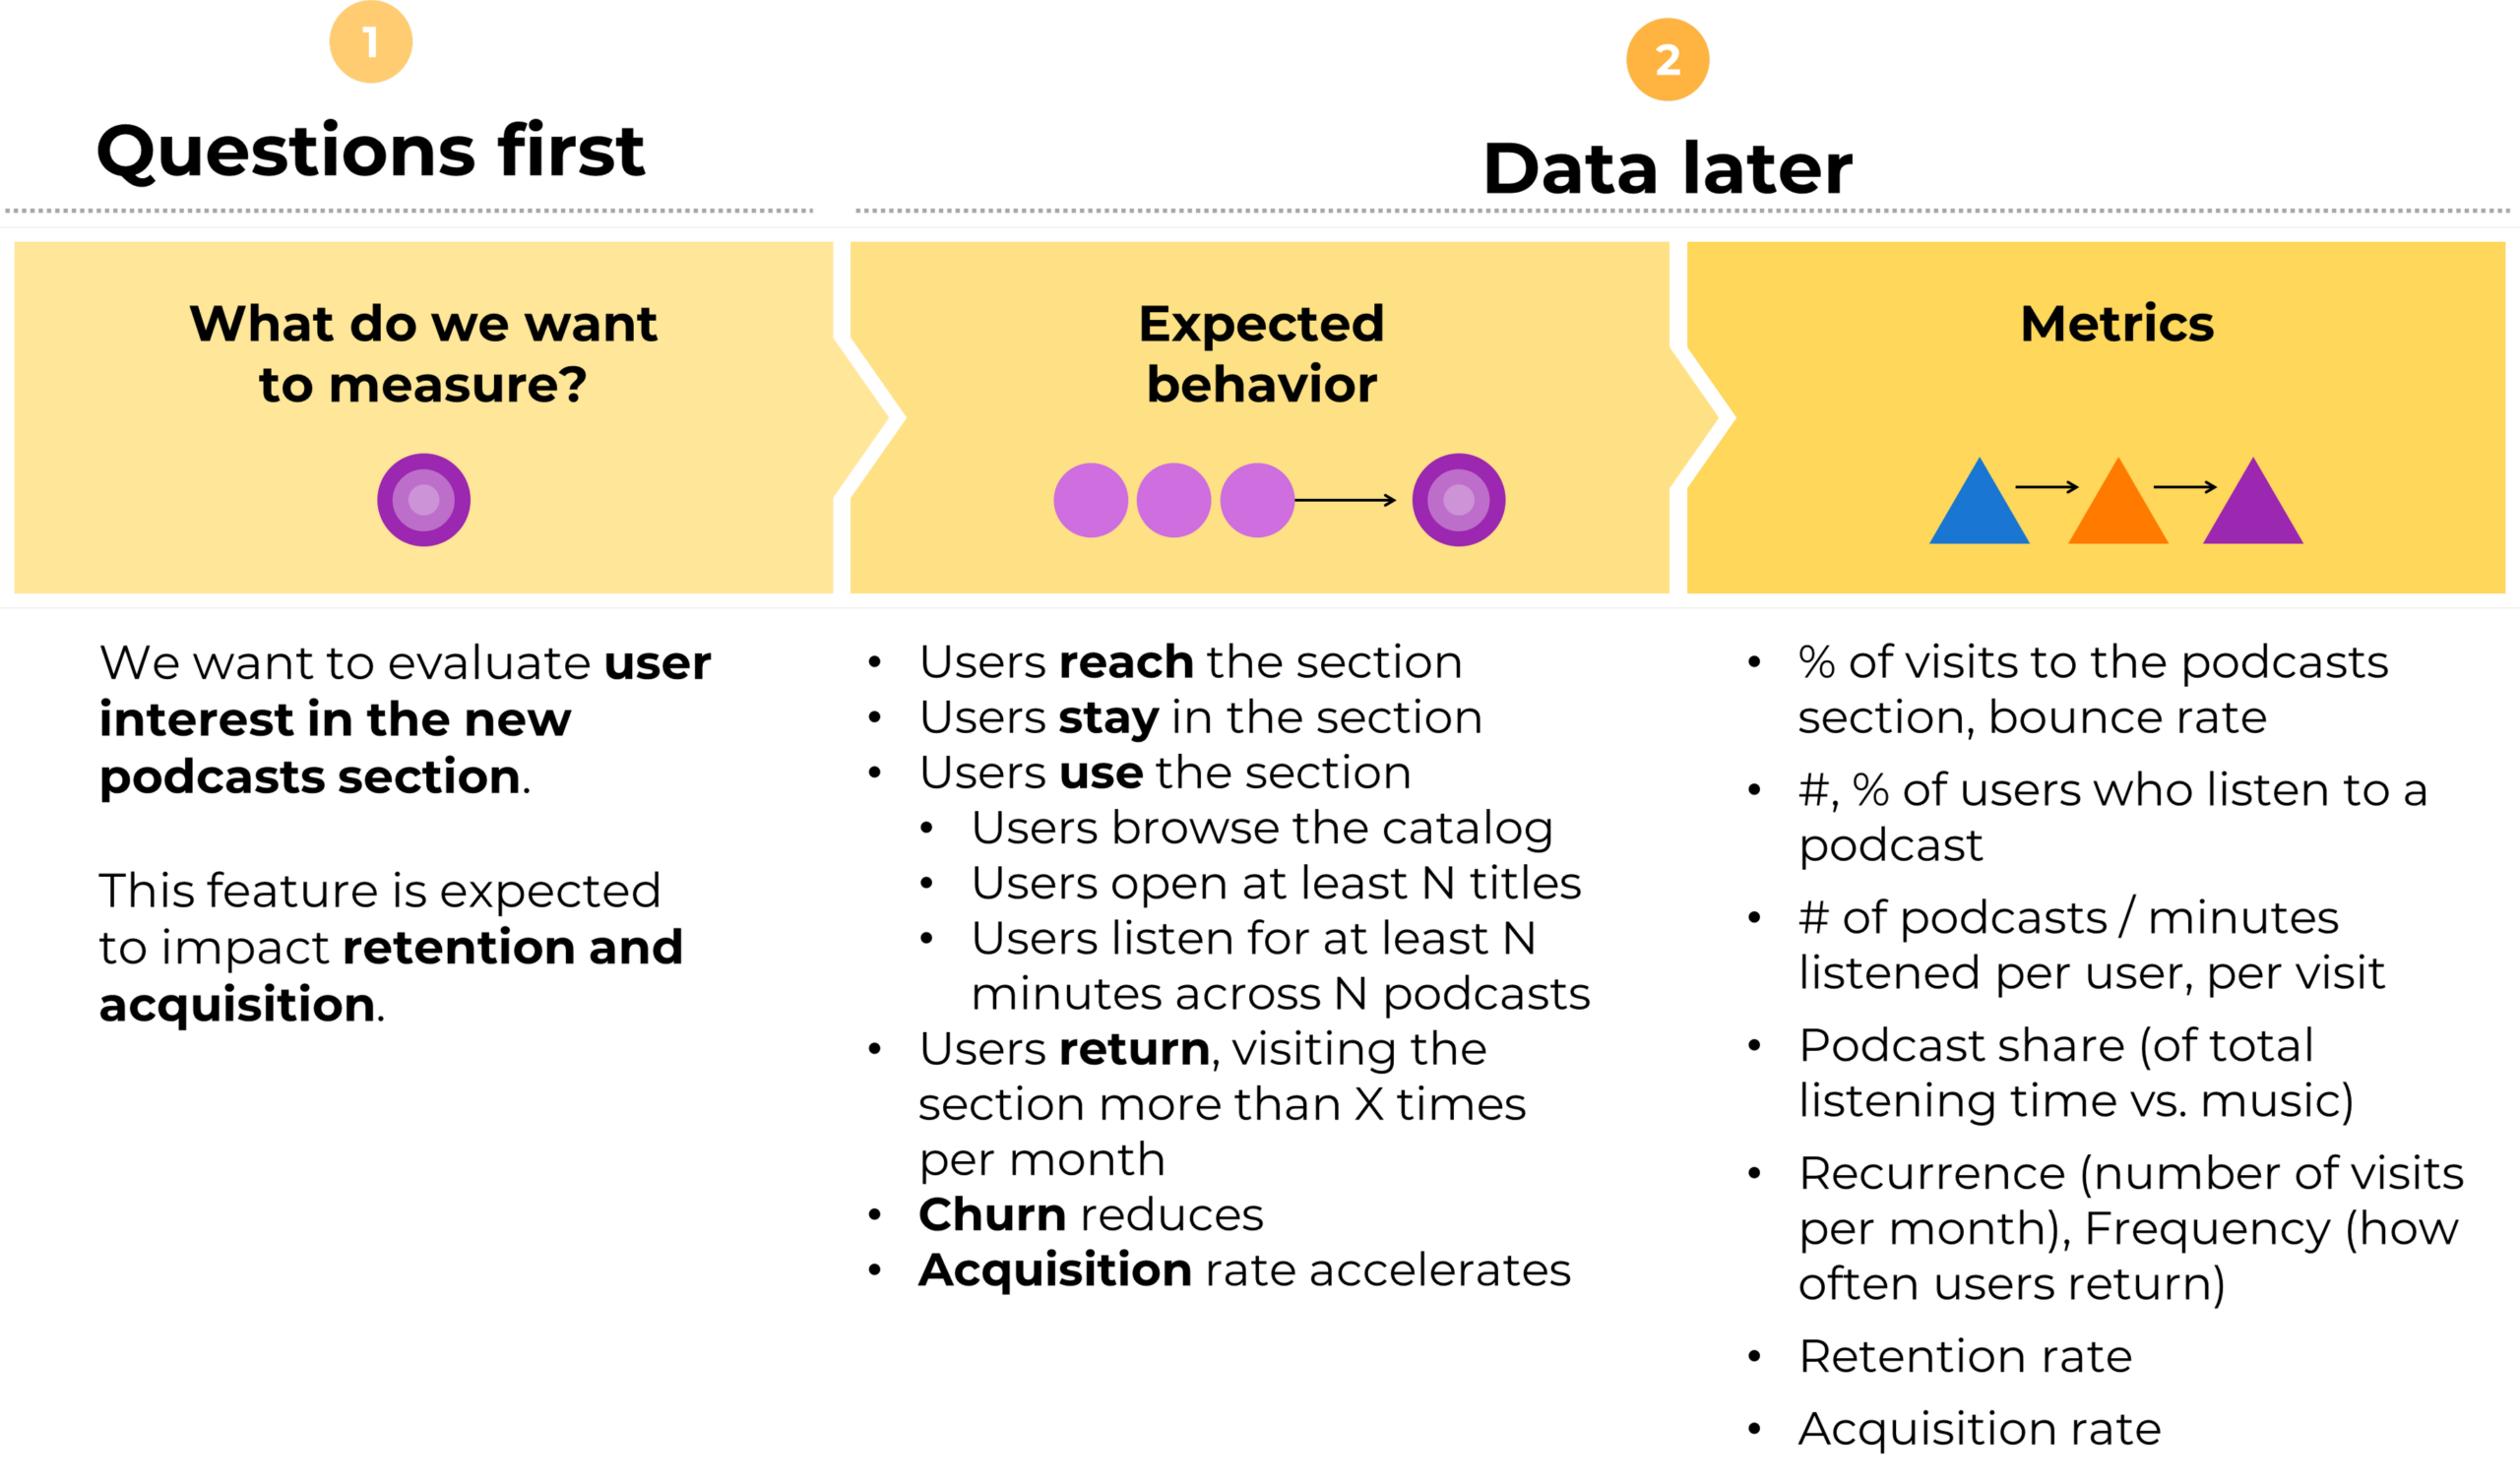
This is how the Questions First canvas would look like with the example above.
Next steps
Here are two versions of the Questions first canvas for you to use:
- High resolution image ready to paste in your favorite digital canvas (Figjam or similar).
- PDF file to fill out as a document.
A common mistake when trying to identify the relevant metrics to assess the performance of a product or a design is starting by asking “Which metrics should we use?” That is, starting with metrics.
When we approach measurement in a data-first way, what we usually end up with is a long list of metrics full of noise, which makes it harder to identify which metrics actually matter. In many cases, this leads to analysis paralysis.
Starting with metrics also leads to what I often call the metrics illusion: confusing having a lot of data with having the right data to make decisions.
An alternative and far more effective approach is to start with the question we want to answer, which is directly tied to the project goal. In other words, a Questions First approach.
Starting the measurement process by thinking about goals helps us find the relevant metrics even if we “don’t know anything about metrics” (*).
If you are a designer, read the clarification at the end of this article.
What is the “Questions First” approach?
The Questions First approach consists of starting the measurement process by thinking about the objective behind the design, product, or feature.
Starting this way allows us to:
- Identify which metrics are actually relevant
- Avoid analysis paralysis
- Make sense of the numbers
“Questions First”: a three-step process
Step 1: What do we want to measure?
As mentioned before, the first step is to identify what we want to measure. To do this, we go back to the project objective:
- What did we do?
- Why did we do it? What result did we expect to achieve?
Important: at this step, we are bringing existing objectives into the conversation, not defining new ones.
The why must be clear before starting the design process. If we don’t know why we did what we did, how can we know whether we actually created impact?
Step 2: Behavior
In this step, we identify the behaviors we should observe in users if the project achieved its objective.
Here, the concepts of core action and supporting actions are extremely helpful.
- Core action: the main action the user must take in order to obtain value from the product or feature
- Supporting actions: actions that enable or facilitate the core action
Important: supporting actions are not an inventory of everything a user can do in the product. They are only the actions that are necessary or enabling for the user to reach the core action in a given context.
This clarification is important because one of the most common mistakes when defining relevant metrics is listing all possible user actions (clicks, scrolls, page views, tagged events, etc.) instead of identifying only those actions that lead to the core action we want to measure—which, of course, is directly related to the project objective.
Step 3: Metrics
Steps 1 and 2 pave the way for identifying the relevant metrics that allow us to answer the question from Step 1 and evaluate whether we achieved our objective—and to what extent.
At this stage, we identify the metrics that can be associated with the behaviors identified in Step 2.
To measure real impact, it is essential to connect usage metrics with product and business metrics.
An example
Let’s assume we are Spotify and, until now, the platform has only offered music. A few months ago, we launched an MVP that adds Podcasts, and now we want to understand whether this MVP is performing well enough to become a permanent feature.
If we apply the Questions First approach…
Step 1: What question do we want to answer?
- We want to know whether users are interested in the new podcasts section (what we did).
- This feature is expected to support retention and acquisition (why we did it).
Step 2: Behavior
What behaviors would we need to observe to know that we achieved our objective?
We would expect users to:
- Reach the podcasts section
- Stay
- Use it
- Browse the catalog
- Open at least N titles
- Listen for at least N minutes across N podcasts
- Return to the podcasts section in subsequent sessions at least X times within a given period (for example, three times in one month)
- Cancel subscriptions less frequently
- Acquire new users at a faster rate than before
The last point is important: if acquisition grows at the same pace as before, we cannot confidently attribute that growth to the new feature.
Notice how:
- Steps 1 and 2 are supporting actions
- Steps 3 and 4 represent the core action
- Steps 5 and 6 are business outcomes resulting from delivering value to users (having music and podcasts on the same platform)
Step 3: Metrics
Once the relevant behaviors are identified, we can associate metrics to them based on the core action we want to measure.
Potential metrics include:
- Percentage of visits to the podcasts section—and its month-over-month evolution (or its opposite: bounce rate)
- Number of users who listen to a podcast—and its month-over-month evolution
- Number of podcasts / minutes listened per user, per visit
- Share of podcast minutes relative to total listening time on the platform—and its evolution (percentage of time spent listening to podcasts vs. music)
- Recurrence (number of visits per month) and frequency (how often users return)
- Retention
- Acquisition
Two important notes about these metrics
- They include only behaviors and actions that are relevant to the core action. This is why metrics such as total platform visits, time on site, error rate, or CTA clicks are excluded.
- The listed metrics include usage, product, and business metrics. They don’t measure a single dimension in isolation; they show how usage translates into product performance and how that, in turn, translates into business results.
This is how the Questions First canvas would look like with the example above.
Next steps
Here are two versions of the Questions first canvas for you to use:
- High resolution image ready to paste in your favorite digital canvas (Figjam or similar).
- PDF file to fill out as a document.